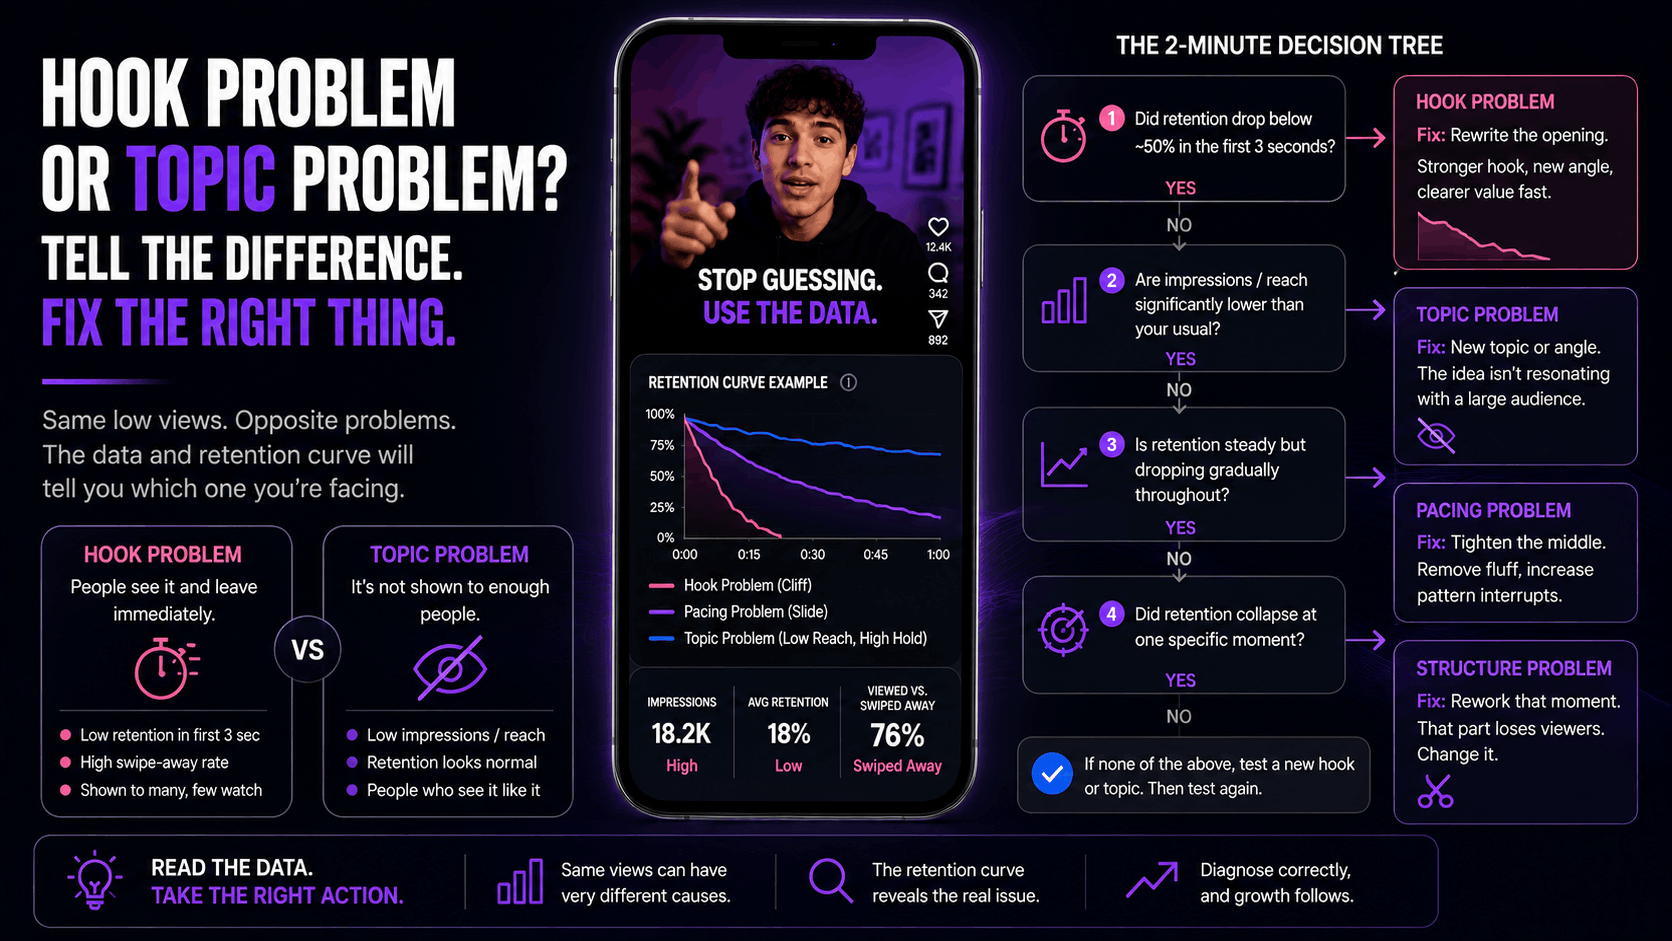
TL;DR: A hook problem and a topic problem look identical in your view count and need opposite fixes. The difference shows up in the retention curve. A cliff in the first three seconds means the hook failed. Steady retention with low reach means the topic didn't have an audience. This guide gives you a decision tree for telling them apart in about two minutes.
Here's the trap. A video underperforms, you decide the hook was weak, you rewrite the hook, and you post the same idea again. It flops again. Now you think you're bad at hooks.
You might be fine at hooks. You might have picked a topic nobody was looking for, and no opening line was ever going to save it.
Telling a hook problem from a topic problem is the single most useful diagnostic skill in short-form video, and almost nobody teaches it. The advice online defaults to "your hook is weak" for every failure, because that advice is easy to give and impossible to disprove. But the two failures leave different fingerprints, and once you know what to look for you can separate them quickly.
What's the Difference Between a Hook Problem and a Topic Problem?
A hook problem means people saw your video and left immediately, usually within the first three seconds. A topic problem means the platform never showed your video to many people in the first place, or the people who watched it all the way through still didn't care. Hook failures show up as bad retention. Topic failures show up as bad reach.
That's the whole distinction, and it's worth reading twice, because everything else follows from it.
Retention answers "did the people who saw this stay?" Reach answers "did the platform decide to show this to anyone?" They're separate systems with separate causes, and your dashboard displays them side by side in a way that makes them easy to blur together.
Why Can't the View Count Tell You Which One Happened?
The view count is a combined output of reach and retention, so two opposite failures can produce the same number. A video shown to 2,000 people that lost most of them instantly, and a video shown to only 350 people who mostly watched it, can both land on 300 views. You need the inputs, not the total.
Views are a combined output. A video with 300 views could be a video that 2,000 people were shown and 1,700 immediately skipped, or a video that only 350 people were ever shown and most of them watched it.
Those are opposite problems. The view count is identical.
This is why creators get stuck. They're reading the one number that mathematically cannot distinguish the two cases. You need the inputs, not the output.
The good news is that platforms have gotten better about exposing those inputs. YouTube now reports a viewed vs. swiped away figure for Shorts, showing "how often a Short was shown in the Shorts feed + if viewers chose to view or swipe away." That single metric splits the question cleanly. Shown a lot and swiped away means hook. Barely shown means topic or distribution.
What Does the Shape of the Retention Curve Tell You?
The shape names the problem. A vertical cliff in the first three seconds is a hook failure. A gentle slide across the whole video is a pacing failure. A healthy curve paired with low reach is a topic failure. A sharp drop at one timestamp is a structure failure at that exact moment.
Before you judge anything, open the retention graph. The shape tells you more in five seconds than the numbers will in five minutes.
Cliff in the first three seconds. Sharp vertical drop, then a flat line. This is a hook problem and nothing else. The topic was never evaluated by the audience, because they left before you got to it.
Gentle slide across the whole video. People stayed a while and drifted off steadily. This is pacing, not hook and not topic. You earned attention and then spent it too slowly.
Strong hold, low reach. The curve looks fine, sometimes great, but very few people saw it. This is your topic signal. The people who found it liked it. The platform didn't think many others would.
Mid-video collapse. Good start, then a specific point where everyone leaves. Go watch that timestamp. Something concrete broke there, usually a tangent or a slow transition.
Length changes what counts as normal, so don't judge a curve without it. Aggregated retention benchmarks for 2026 put TikTok videos under 15 seconds at 60 to 70% retention, while 30 to 60 second videos average 40 to 50%. A frame-by-frame analysis of 315 Reels found short reels holding 66.9% of their length against just 15.9% for reels over 60 seconds. A 45% hold means something very different on a 10-second video than on a 90-second one.
Our breakdown of hook rate and how to calculate it covers the first-three-seconds math in more detail if you want the formula.
The Two-Minute Decision Tree
Run this in order. Stop at the first yes.
Step 1. Did retention drop below roughly half within the first three seconds? Yes, it's a hook problem. Stop here. Rewrite the opening, keep the topic, post it again.
Step 2. Was reach far below your normal, while retention stayed near or above your average? Yes, it's a topic or distribution problem. The video was good. The subject didn't have demand, or the platform misread who to show it to.
Step 3. Did retention hold early, then collapse at one specific timestamp? Yes, it's a structure problem. Go to that second and cut what's there.
Step 4. Did everything look roughly normal, just smaller? Then this is probably variance, not a failure. Not every post is a lesson. Seed audiences differ, and a single quiet post is often just a quiet post.
Step 4 matters more than people want to hear. Typical reach is lower than the highlight reels suggest: the median reel in that 315-video sample got 341 views, with the bottom quarter under 140. Measured against reality rather than against your best day, a lot of "flops" are just ordinary posts.
The step people skip is defining "your normal" in the first place. You can't run step 2 without knowing your usual reach and your usual retention, and most creators are working from a vague feeling rather than a number. Pull your median from the last thirty posts, not your mean, since one runaway video will drag an average badly out of shape. Our guide to analyzing social media performance the right way walks through setting that baseline properly.
If you want the curve and the read without doing this by hand, you can run a free analysis on the video and get the shape plus the diagnosis in about thirty seconds.
Why "Fix Your Hook" Is Bad Advice for Topic Failures
Applying a hook fix to a topic problem does real damage, and it's worth understanding why.
When you rewrite the hook on a video whose topic had no audience, you usually make it louder. Bigger claim, faster cut, more urgent text. The video gets more aggressive without getting more interesting. If it goes out again and underperforms again, you conclude the format is dead, when the actual issue was subject demand.
Meanwhile you've trained yourself toward a punchier style that your audience may not want at all. That's the expensive part. You've optimized against a misdiagnosis, and the change persists across everything you post next.
The reverse mistake is cheaper but still costly. Treating a hook failure as a topic failure makes you abandon subjects that would have worked fine with three better seconds. Creators drop entire content pillars this way.
There's a compounding cost too. Every misdiagnosis writes a false rule into your head: "my audience doesn't like tutorials," "long videos don't work for me," "I can't do talking head." Those rules stick around long after the video that produced them, and they quietly shrink what you're willing to make. A year of confident misdiagnosis leaves you with a much smaller creative range than you started with. Our post on why reels flatline and the three structural fixes covers the structural failures that get misread as hook failures most often.
How Do You Confirm Which One It Was?
Repost the same topic with a completely different hook, and change nothing else. If the video performs meaningfully better, the hook was the problem. If it performs about the same, the topic was.
This is the only reliable confirmation, and it costs you one post.
Keep the test clean. Same length, same sound, same posting window, same caption style. Change the opening and only the opening. If you change three things and it works, you've learned nothing about which change mattered, which is the same trap as before in a new outfit. Our guide to A/B testing your Instagram Reels covers how to keep a test honest.
One caution: give it a real sample. Two posts prove nothing. Platform distribution has a large random component, so a single repost that does better might just be a better seed audience. Three or four attempts on the same topic with different openings will tell you something. One won't.
What the Platforms Reward, and Why Hooks Matter So Much
Hooks get so much attention for a reason. The ranking systems genuinely front-load them.
Hootsuite's breakdown of TikTok's ranking signals places watch time and completion rate at the top of the hierarchy, calling them "the single strongest signals," with replays and shares close behind. Likes sit noticeably lower. That means a video people enjoy but don't finish is a weaker signal than one people finish without reacting at all.
The distribution mechanics reinforce it. vidIQ describes the Shorts algorithm as an explore-then-exploit loop: your video goes to a small seed audience first, and only expands if that group sticks around. Lose them in second two and there's no second wave to recover in.
So hooks matter enormously. They're just not the explanation for every failure, and treating them as one is how people stop learning.
It's also worth knowing that engagement is drifting downward generally. Socialinsider's 2026 benchmark data shows average Instagram engagement at 0.45%, down from 0.52% a year earlier. Some of your decline is the field moving, not you.
One more thing the hook obsession hides: the gap between average and excellent is mostly not about openings. In that 315-reel study, the top 10% of posts averaged 30.0% engagement per view against 4.1% for the mid-pack, with a 49.2% watch ratio against 30.2%. Those top posts are holding people all the way through, not just catching them at second one. A great hook on a thin idea still produces a cliff, just a few seconds later. If you want to know which of your numbers actually deserve attention, our breakdown of the Reels metrics that matter sorts the useful from the vanity.
The Short Version
Hook problems and topic problems look identical in a view count and need opposite responses. Getting the diagnosis right is worth more than any individual fix.
Three things to hold onto. Read the shape of the retention curve before you touch anything, because the shape names the problem. Judge reach and retention separately, since they fail for different reasons. And confirm your diagnosis by reposting the topic with a new hook and changing nothing else.
You don't have to guess at this. Start your $1 trial and get 30 days of full analysis across your account, including the retention curves on every post you've been arguing with yourself about.
Frequently Asked Questions
How fast does a hook have to work?
About three seconds, and often less. That's the window where viewers decide whether to keep watching, and where the platform starts collecting the retention signal that determines distribution. If your retention graph is already falling steeply before second three, nothing later in the video is being evaluated.
Can a video have both a hook problem and a topic problem?
Yes, and it's common. The way to separate them is to fix the hook first, because it's cheaper and faster to test. If retention improves but reach stays low, you've solved the hook and confirmed a topic issue underneath it.
Does low reach always mean the topic was wrong?
No. Low reach can also come from posting into a quiet window, an account in a temporary slump, or plain variance in the seed audience. Treat low reach as a signal worth investigating across three or four posts on the same topic, not a verdict on a single video.
Should I delete videos that flopped?
Usually not. Deleting removes the data you need to spot patterns, and there's no reliable evidence that a low-performing post drags down later ones. The exception is content that misrepresents you or your brand, which is a judgment call rather than an analytics one.
How many posts do I need before these patterns are trustworthy?
Roughly thirty to fifty on the same account. Below that, the random component in distribution is large enough that you'll find patterns that aren't there. Early conclusions are worth holding loosely.
Frequently asked questions
How fast does a hook have to work?
About three seconds, and often less. That's the window where viewers decide whether to keep watching, and where the platform starts collecting the retention signal that determines distribution. If your retention graph is already falling steeply before second three, nothing later in the video is being evaluated.
Can a video have both a hook problem and a topic problem?
Yes, and it's common. The way to separate them is to fix the hook first, because it's cheaper and faster to test. If retention improves but reach stays low, you've solved the hook and confirmed a topic issue underneath it.
Does low reach always mean the topic was wrong?
No. Low reach can also come from posting into a quiet window, an account in a temporary slump, or plain variance in the seed audience. Treat low reach as a signal worth investigating across three or four posts on the same topic, not a verdict on a single video.
Should I delete videos that flopped?
Usually not. Deleting removes the data you need to spot patterns, and there's no reliable evidence that a low-performing post drags down later ones. The exception is content that misrepresents you or your brand, which is a judgment call rather than an analytics one.
How many posts do I need before these patterns are trustworthy?
Roughly thirty to fifty on the same account. Below that, the random component in distribution is large enough that you'll find patterns that aren't there. Early conclusions are worth holding loosely.