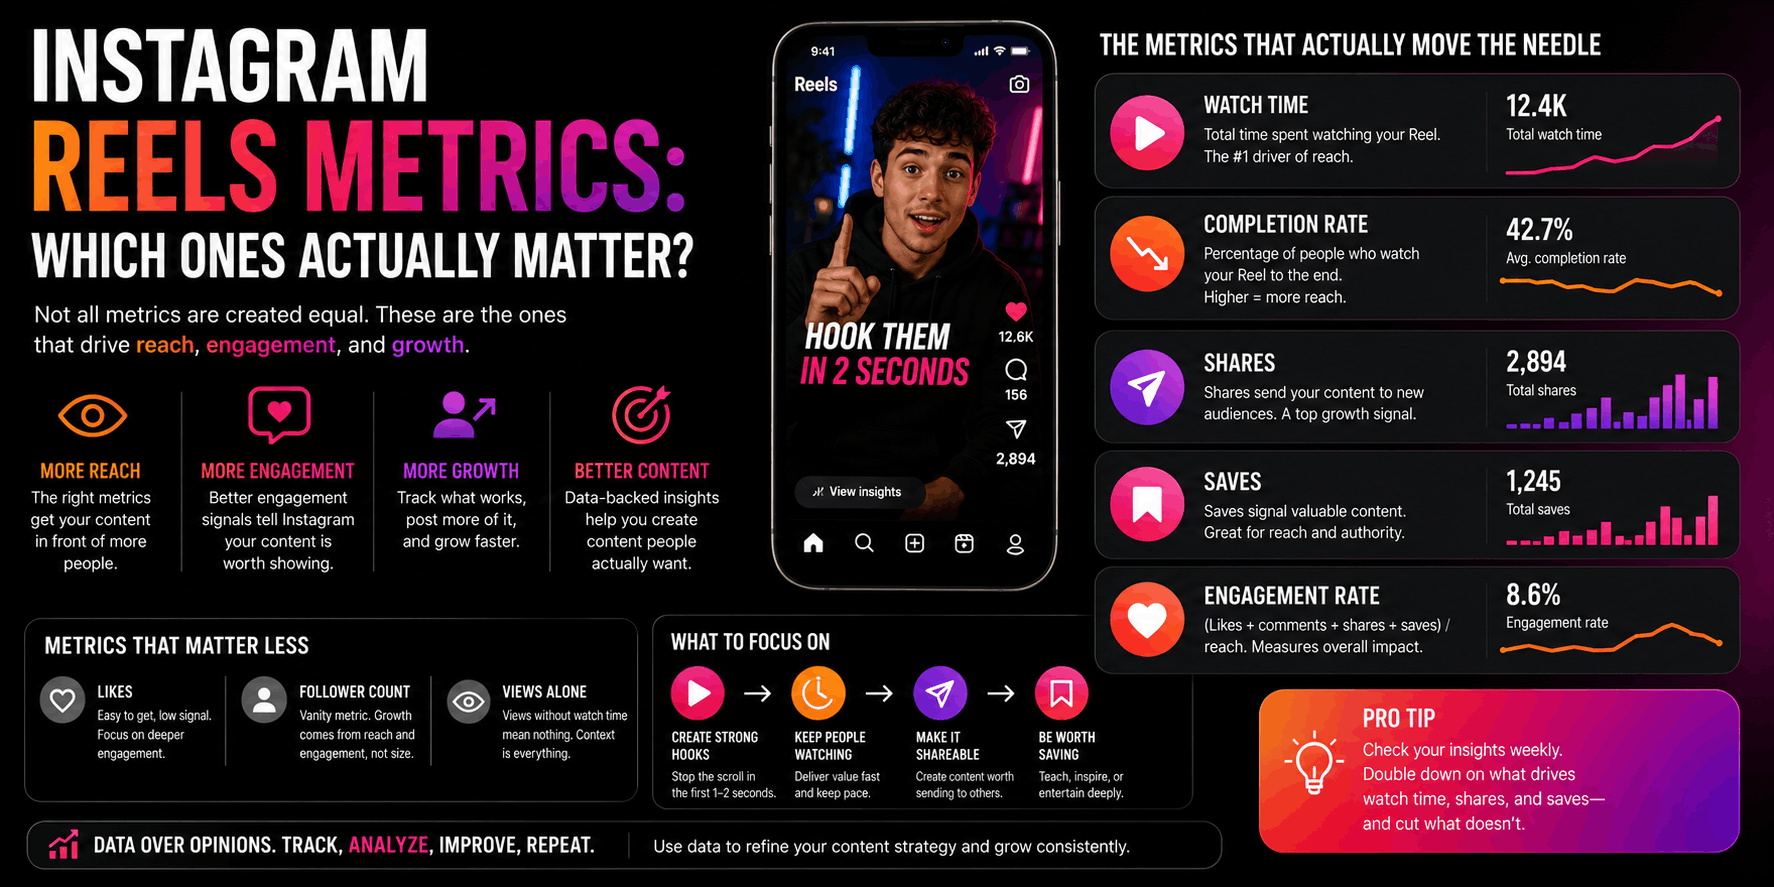
TL;DR: Your Reels dashboard throws a dozen numbers at you, and most of them are noise. In 2026, only a handful of Instagram Reels metrics actually predict reach: watch time, completion rate, and DM shares. Likes barely register anymore. This breaks down which metrics move your Reels, which ones you can ignore, and what to check first after you hit publish.
You post a Reel. Ten minutes later you're refreshing the insights tab, staring at reach, likes, comments, shares, saves, average watch time, and plays, trying to figure out if this one is "doing well."
Here's the problem: most of those Instagram Reels metrics don't actually tell you anything the algorithm cares about. You're reading a scoreboard for the wrong game.
Instagram's own head of product, Adam Mosseri, has confirmed which signals the ranking system actually weighs, and the list is shorter than your analytics dashboard suggests. Watch time, likes per reach, and DM shares are the three most important ranking factors, and they are not weighted equally.
This article breaks down exactly which metrics matter for Reels distribution, which ones are safe to ignore, and how to check the right numbers before your next post instead of after.
Want a system that tells you which metrics to fix before you publish, instead of after? Try Wave Vision for $1 →
What Metrics Does Instagram Actually Use to Rank Your Reels?
Instagram ranks Reels primarily on watch time, DM sends, and likes relative to reach, in that order of weight. Everything else on your insights screen, including total likes, follower count, and raw view count, plays a much smaller role in whether your Reel gets shown beyond your existing audience.
Mosseri confirmed this hierarchy in January 2025 and has repeated it consistently since. The first checkpoint happens fast: Instagram heavily weighs whether a viewer keeps watching past the first three seconds. If they drop off before that mark, the algorithm treats it as a signal to stop testing your Reel with new audiences.
If your Reel survives that first check, the system moves to a second layer: rewatches, full completions, and whether someone paused mid-scroll to read your on-screen text. Each surface on Instagram weighs signals differently too. Reels prioritizes watch time and sends, while Feed leans harder on relationship strength and Stories leans on recency. If you want the full breakdown of what drives distribution across formats, our guide on 12 factors that affect Instagram performance covers the Stories-specific signals in more depth.
Why Don't Likes Matter as Much on Reels Anymore?
A like is the weakest engagement signal Instagram tracks because it takes almost no effort and doesn't prove the content was worth anyone's time. In 2026, DM shares carry three to five times the algorithmic weight of a like, and saves carry meaningfully more weight too.
Think about what each action actually costs the viewer. A like is a half-second double-tap someone does while barely paying attention. A share means they stopped, thought of a specific person, and sent it. That's a much stronger signal that your content was worth something.
The data backs this up in a way that should change how you evaluate your own content. Research cited by industry analysts found that DM shares correlate with purchase intent roughly four times more strongly than likes do, and saves correlate about three times more strongly. Likes barely correlate with anything beyond mild interest. If you're still judging a Reel's success by its like count, you're optimizing for the metric that predicts the least.
Mosseri has said directly that one DM share to a non-follower can carry more weight than fifty likes from your existing audience, because it signals your content is worth spreading to people outside your current reach. That's the entire game: getting shown to people who don't already follow you.
Watch Time or Completion Rate: Which One Should You Chase?
Completion rate matters more than raw watch time, but the two aren't in competition. Watch time is the total number of seconds someone spends on your Reel. Completion rate is the percentage of your Reel they actually finished. Instagram treats a high completion rate as proof of quality, even on a short video.
Here's where it gets nuanced. A 15-second Reel with 90% retention and a 45-second Reel with 70% retention can both perform well, but the longer one may accumulate more total seconds watched per viewer even with a lower percentage. Instagram's system optimizes for both signals, and the balance shifts depending on your Reel's length.
The practical takeaway: don't stretch a Reel just to rack up watch time, and don't assume a short Reel with high retention automatically beats a longer one. Match the length to how much content you actually have. A 60-second Reel with 25% average completion will typically underperform a 15-second Reel with 80% completion, even though the longer video technically has more raw seconds on the clock.
What's a Good Completion Rate for an Instagram Reel?
A good completion rate depends heavily on length. Sub-15-second Reels should aim for 50% or higher, while Reels over 30 seconds should aim for 30% or higher. The platform-wide average sits around 53%, but that number gets pulled in different directions depending on how long your Reels run.
The length breakdown matters more than the single average. Reels between 7 and 15 seconds average roughly 74% completion, 30-to-60-second Reels average around 49%, and anything past 60 seconds drops to about 46%. Shorter Reels have a structural advantage here simply because there's less runway for someone to scroll away.
If you're consistently landing below these benchmarks, the fix usually isn't your topic. It's your pacing. Hook rate, hold rate, and completion rate together are the three metrics that most reliably predict whether a Reel gets meaningful reach, and hold rate specifically tracks where in the video people start dropping off. That's the number to check before you blame the algorithm.
The Metrics You Can Safely Ignore
Not every number in your insights tab deserves your attention. A few of them actively mislead creators into making the wrong changes.
Total likes. As covered above, likes are the weakest predictor of reach. A high like count feels good but doesn't tell you whether the Reel actually traveled beyond your followers.
Follower count day to day. Follower counts fluctuate constantly and lag behind actual content performance by days or weeks. Watching this number after every post is a fast way to make decisions based on noise instead of signal.
Raw view count without context. A view only requires someone to watch for a fraction of a second. Without pairing it against watch time or completion rate, a high view count tells you almost nothing about whether the content actually worked.
One breakdown of Instagram analytics for creators puts it plainly: there are about five metrics worth tracking and at least four that are safe to ignore entirely. If a metric doesn't tie back to watch time, completion, or shares, it's probably not worth your energy.
How to Track the Metrics That Actually Move the Needle
Tracking the right Reels metrics manually means checking watch time, completion rate, and shares on every post, then comparing them against your account's baseline over time. That's doable for one or two posts a week. It gets unmanageable fast once you're posting daily across multiple platforms.
Most native analytics tabs also make this harder than it needs to be. Instagram shows you the numbers but not what to change. You still have to figure out whether a 40% completion rate on a 20-second Reel is a problem or perfectly normal for your niche. Our guide to the best Instagram analytics tools for creators walks through several options if you want to compare what's out there.
This is the gap Wave Vision's Vision Score was built to close. Instead of handing you a dashboard full of numbers, it scores your content against the specific signals proven to drive distribution (hook strength, predicted retention, share likelihood) and tells you what to fix before you publish. If you're weighing it against a content-creation tool instead of an analytics tool, our breakdown of Wave Vision versus Blort AI explains the difference.
Which Metric Should You Check First After You Post?
Check your hold rate at the three-second mark first, since it predicts almost everything that follows. If a large chunk of viewers are gone before three seconds, no other metric on the Reel matters yet because the algorithm has already limited how many people will see it next.
After that, check completion rate against the benchmarks for your Reel's length. Then check DM shares, since that's the strongest signal for reaching people who don't already follow you. Likes and total views can wait. They're the last thing worth your attention, not the first.
Conclusion
Instagram Reels metrics aren't complicated once you strip out the noise. Watch time, completion rate, and DM shares drive distribution. Likes, follower count swings, and raw views are mostly vanity numbers that feel good but don't predict reach.
The creators who grow consistently aren't the ones obsessing over every number in their insights tab. They're the ones checking the three or four metrics that actually matter and adjusting their next Reel based on what those numbers say.
You don't have to guess which metric is holding your Reels back. See your Vision Score before your next post and know exactly what to fix. Start your $1 Wave Vision trial →
Frequently Asked Questions
What are the three most important Instagram Reels metrics in 2026?
Watch time, likes per reach, and DM shares are the three metrics Adam Mosseri has confirmed matter most for ranking. Watch time is checked first, especially in the first three seconds, followed by whether the content gets shared directly to other people.
Does watch time matter more than likes for Reels?
Yes, significantly more. Watch time and completion tell Instagram whether people actually found the content worth their time, while a like requires almost no effort and correlates weakly with real interest. DM shares carry three to five times the weight of a like in ranking decisions.
What's a good completion rate for an Instagram Reel?
It depends on length. Aim for 50% or higher on Reels under 15 seconds and 30% or higher on Reels over 30 seconds. The platform-wide average is around 53%, but shorter Reels naturally post higher completion rates than longer ones.
Do saves help Reels get more reach?
Yes. Saves signal that someone found the content valuable enough to revisit, and they carry meaningfully more algorithmic weight than likes. Research suggests saves correlate with purchase intent roughly three times more strongly than likes do.
Can you predict which metrics your Reels will hit before you post?
Yes. Tools like Wave Vision's Vision Score analyze your content against the signals proven to drive distribution, including hook strength, predicted retention, and share likelihood, and give you a score with specific feedback before you publish instead of after.
Wave Vision is an AI-powered social media analytics platform that predicts content performance before you post. Try it for $1 at wavevision.com.
Frequently asked questions
What are the three most important Instagram Reels metrics in 2026?
Watch time, likes per reach, and DM shares are the three metrics Adam Mosseri has confirmed matter most for ranking. Watch time is checked first, especially in the first three seconds, followed by whether the content gets shared directly to other people.
Does watch time matter more than likes for Reels?
Yes, significantly more. Watch time and completion tell Instagram whether people actually found the content worth their time, while a like requires almost no effort and correlates weakly with real interest. DM shares carry three to five times the weight of a like in ranking decisions.
What's a good completion rate for an Instagram Reel?
It depends on length. Aim for 50% or higher on Reels under 15 seconds and 30% or higher on Reels over 30 seconds. The platform-wide average is around 53%, but shorter Reels naturally post higher completion rates than longer ones.
Do saves help Reels get more reach?
Yes. Saves signal that someone found the content valuable enough to revisit, and they carry meaningfully more algorithmic weight than likes. Research suggests saves correlate with purchase intent roughly three times more strongly than likes do.
Can you predict which metrics your Reels will hit before you post?
Yes. Tools like Wave Vision's Vision Score analyze your content against the signals proven to drive distribution, including hook strength, predicted retention, and share likelihood, and give you a score with specific feedback before you publish instead of after.