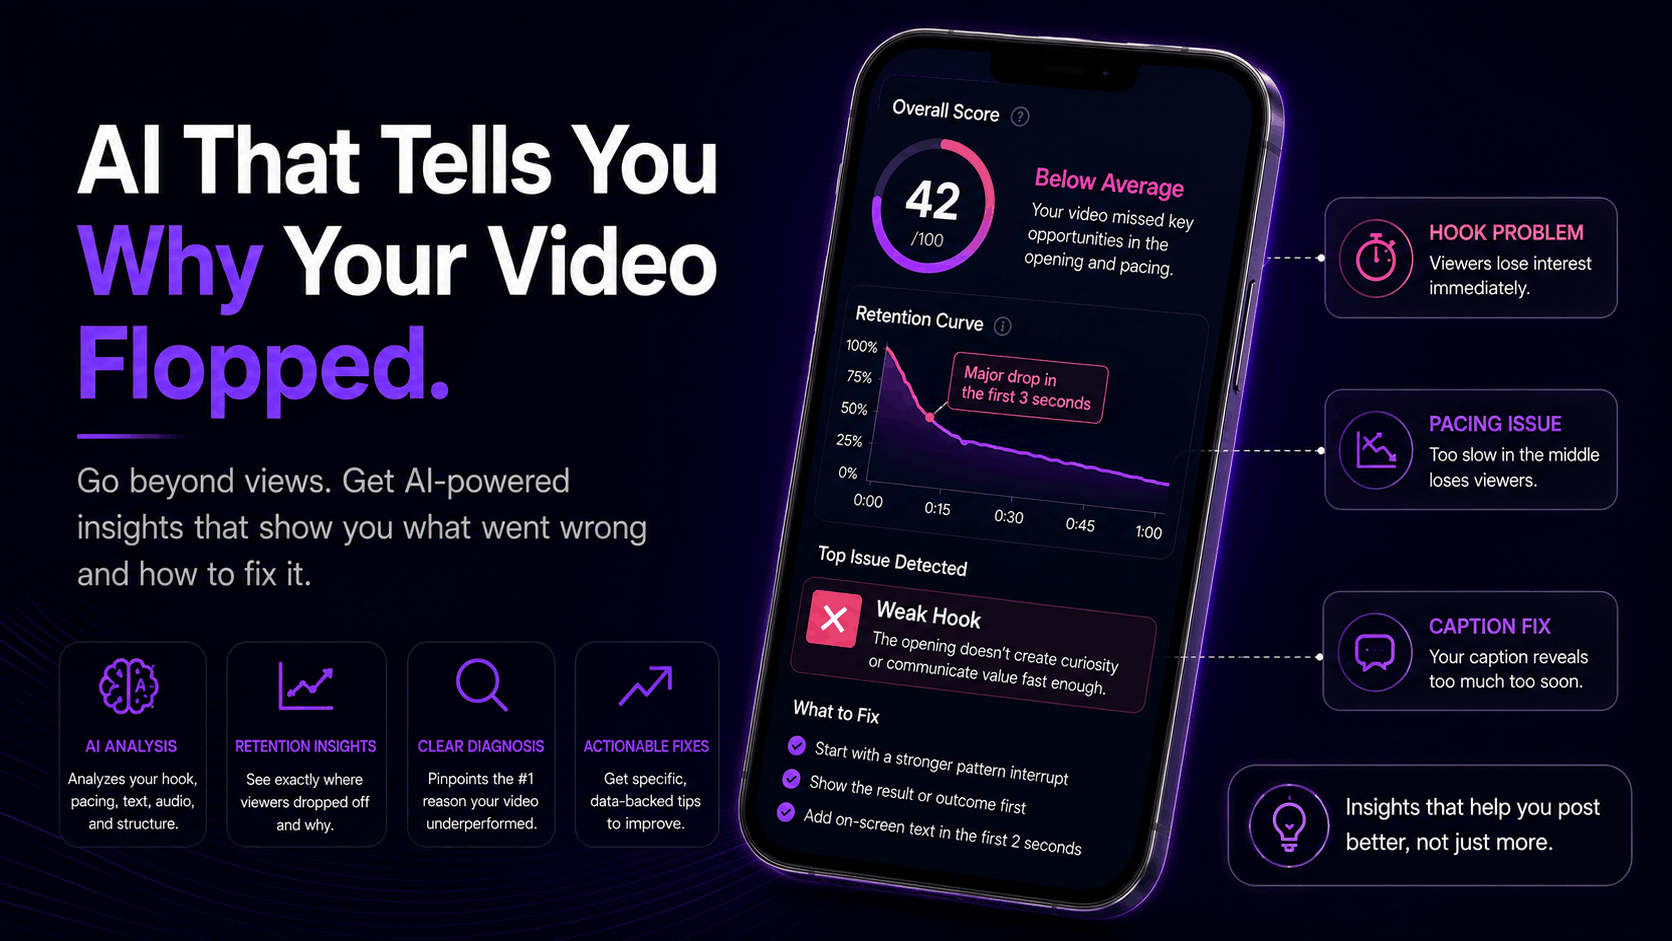
TL;DR: Most analytics dashboards tell you a video flopped. They don't tell you why. An AI video analyzer reads the actual content of your video, the hook, the pacing, the caption, the sound, and lines it up against your own history to explain which part lost people. This guide covers what these tools measure, what they get right, what they still can't do, and how to use one without wasting an afternoon.
You posted something you were proud of. It got 400 views. The one you filmed in twelve seconds got 40,000. You open your analytics, and the app cheerfully shows you a chart of the 400 views.
Thanks for that.
An AI tool that tells you why your video flopped is trying to solve the gap between those two things: the number, and the reason. Standard analytics are a scoreboard. They're very good at telling you what happened and completely silent on what caused it. And when you're posting four or five times a week, "what caused it" is the only question that actually changes what you do tomorrow.
This isn't a magic button. Nothing reads your video and hands you a guaranteed viral formula, and you should be suspicious of anything that claims it does. But the gap between a scoreboard and an explanation is real, and it's closable. Here's what's actually possible in 2026, and how to tell a useful tool from an expensive one.
What Is an AI Tool That Tells You Why Your Video Flopped?
An AI video analyzer is software that reads the content of your video itself, not just its performance numbers, and compares it against how your audience has responded to your past videos. It looks at the hook, pacing, on-screen text, caption, sound choice, and structure, then points to the specific element most likely responsible for the drop-off.
The important word there is content. Your native analytics only ever see the outcome. They know a video got a 22% completion rate. They have no idea that the first three seconds were a slow pan of your ceiling, or that your caption gave away the punchline, or that you used a trending sound that peaked six weeks ago.
An analyzer looks at both halves. It reads the video, reads the result, and looks for the pattern connecting them. That's a different job from reporting, and it needs a different kind of tool.
Why Regular Dashboards Can't Answer "Why"
This isn't a knock on the platforms. Native analytics are genuinely good at what they're built for. The problem is that what they're built for is measurement, not diagnosis.
Buffer's guide to Shorts analytics makes this point almost by accident. It walks through every metric YouTube gives you, then notes that the guidance "focuses on comparing your content performance internally and identifying patterns rather than meeting external standards." In other words: here are your numbers, good luck finding the pattern yourself.
Doing that by hand is the part nobody has time for. To spot a real pattern you'd need to watch your last forty videos back to back, note the hook style of each one, tag the sound, tag the length, tag the topic, and then correlate all of that against retention. That's a weekend. Every week.
There's also a plain visibility problem. YouTube's viewed vs. swiped away metric only arrived recently, letting creators finally see "how often a Short was shown in the Shorts feed + if viewers chose to view or swipe away." That's a genuinely useful signal, and creators went years without it. Plenty of equivalent signals on other platforms are still missing entirely.
What Signals Actually Explain a Flop?
Four signals explain most flops: hook retention in the first three seconds, overall completion rate, share and save rate relative to reach, and how your video performed against your own baseline rather than a global average. A flop is almost always a failure in one specific one of these, not a general failure of the video.
That last point matters more than people expect. A 30% completion rate sounds bad in isolation. If your account normally runs at 22%, it isn't bad at all, and chasing it would be a mistake.
Context helps here. Aggregated retention benchmarks for 2026 put TikTok around 40 to 50% on average, Instagram Reels at 45 to 65%, and YouTube Shorts at 40 to 55%, with shorter videos scoring much higher in every case. A frame-by-frame study of 315 Reels across 96 accounts found the median reel holds just 31.7% of its length, dropping to 15.9% once a reel passes 60 seconds. So a 40% hold on a one-minute video is strong, and the same 40% on a 10-second video is a problem. Length changes the meaning of the number entirely.
The first three seconds carry disproportionate weight because that's where the platform makes its decision. vidIQ describes the Shorts algorithm as running an explore-then-exploit loop: your video goes to a small seed audience first, and only expands if that group sticks around. Lose them early and there is no second wave. Our guide to the metrics that actually matter on Reels breaks down which of these numbers deserve your attention day to day. Hootsuite's breakdown of TikTok's ranking signals puts watch time and completion rate at the very top of the hierarchy, describing them as "the single strongest signals," with replays and shares alongside them. Comments, follows and saves sit a tier below. Likes, notably, sit lower still.
So a video with strong likes and weak completion isn't a video the algorithm liked. It's a video that a small number of people enjoyed and most people left. Those are very different diagnoses, and your dashboard shows you the likes first.
If you want to understand how the drop-off math actually works before you go further, our breakdown of hook rate and why it controls your reach covers the calculation in detail.
The Four Shapes of a Flop
Retention curves aren't all the same shape, and the shape is the diagnosis. Once you learn to read these, you can often skip the tool entirely for obvious cases.
The cliff. Retention falls off a wall in the first two or three seconds and never recovers. This is a hook problem, full stop. The topic never got a chance. Nothing after second three matters because almost nobody saw it.
The slide. A steady, gentle decline all the way through. This usually means pacing. People are mildly interested but you're taking too long to deliver. The fix is cutting, not rewriting.
The mid-drop. Strong start, then a sharp fall somewhere in the middle. Something specific broke the spell: a tangent, a slow transition, a moment where you explained something the viewer already understood.
The flat-but-low. Decent retention, terrible reach. This isn't a content problem at all. The video held the people who saw it, and not many people saw it. That points at distribution, timing, or topic demand rather than execution.
This shape is more common than most creators assume, because typical reach is lower than the highlight reels suggest. The median reel in that 315-video sample got 341 views, with the bottom quarter under 140. Measured against that, plenty of "flops" are simply ordinary posts that landed in an unremarkable seed audience.
Most creators diagnose every flop as a hook problem, because that's the advice everyone repeats. In practice a good chunk of them are slides and flat-but-lows, which means the "fix your hook" advice actively makes things worse. Our post on why reels flatline and the three structural fixes goes deeper on the structural side of this.
If you want to see which shape your last video actually made, you can run a free analysis on it and get the curve plus the read in about thirty seconds.
How Does an AI Video Analyzer Actually Work?
Most analyzers run three passes. First, they break the video into its parts: transcript, on-screen text, scene changes, sound, pacing, caption, and length. Second, they pull your performance data for that video and for your recent history. Third, they compare the two, looking for which content features track with better or worse retention on your specific account.
The third pass is where the value is, and where tools differ most.
A weak tool compares your video to a generic best-practice checklist. It will tell you that your hook should be shorter, your captions should be bigger, and you should post at 6pm. That's a blog post with a login screen.
A strong tool compares your video to you. It notices that your face-first hooks outperform your text-first hooks by a wide margin on your account, even though the general advice says the opposite. It notices that your videos over 45 seconds hold retention fine while conventional wisdom says to cut everything to 20.
Generic advice fails here because the averages are genuinely close. In that same Reels study, face-to-camera openings and cinematic b-roll openings landed within a rounding error of each other, at 9.0% and 9.1% engagement per view. There's no universal winner to copy. There's only what works on your account, which is a different question and one only your own data can answer.
This is why account history matters so much. A tool analyzing your fifth video has almost nothing to work with. A tool analyzing your two hundredth has a real dataset. vidIQ's breakdown of the Shorts algorithm makes a similar observation from the platform side, noting that channels which have published at least 200 Shorts tend to see views climb steadily over time. Volume builds the pattern, for the algorithm and for your analytics both.
What These Tools Still Can't Do
Worth being straight about this, because the category has some loud overclaiming in it.
They can't predict virality reliably. They can tell you a video resembles your past winners. Resemblance is not a forecast. Distribution has a large random component, and anyone selling certainty is selling something else.
They can't judge whether an idea is good. An analyzer can tell you your hook lost people at second two. It cannot tell you that the topic was boring to begin with. Taste is still yours.
They can't fix a small-sample problem. If you've posted eleven videos, there's no pattern to find. Any tool that hands you confident conclusions from eleven data points is generating noise with a nice interface.
They're bad at novelty. If you try something genuinely new, the model has no precedent for it on your account and will usually rate it against the wrong baseline. Sometimes the flop is the price of the experiment.
They inherit the platform's blind spots. Length is a good example. vidIQ cites research across 35 billion views finding that Shorts perform best at either 13 or 60 seconds, which is not a smooth curve and not something a simple "make it shorter" recommendation would ever surface. Tools trained on conventional wisdom repeat conventional wisdom.
Engagement is also drifting downward across the board, which distorts how people read their own numbers. Socialinsider's 2026 benchmark data puts average Instagram engagement at 0.45% in early 2026, down from 0.52% a year earlier, while TikTok sits at 2.60%. If your numbers slipped slightly year over year, some of that is the platform, not you. A tool that doesn't account for baseline drift will tell you that you got worse when the whole field moved.
How Do You Use One Without Wasting Your Time?
Analyze your flops in batches, not one at a time. Take your five worst performers from the last month, run them together, and look for the repeated element rather than the individual verdict. One bad video tells you almost nothing. Five bad videos with the same hook structure tells you exactly what to change.
Then change one thing. Not four.
This is the part most people get wrong. They read a report, get five recommendations, and rewrite everything at once. The next video does better, and now they have no idea which change caused it. You've learned nothing and you'll repeat the guesswork next week.
A workable loop looks like this:
1. Batch-analyze your five worst recent videos.
2. Find the element that repeats across at least three of them.
3. Change only that element for your next four videos.
4. Compare those four against your baseline, not against your best video ever.
5. Keep the change or drop it, then pick the next variable.
That's slow. It's also the only version that produces knowledge instead of superstition. If you want a starting point, analyze your last five posts free and see whether the same element shows up in more than half of them. If you want the fuller version of this method, our guide to analyzing social media performance the right way walks through it step by step.
One more habit worth building: check your reach and your retention separately, every time. They fail for different reasons and they have different fixes. Treating "it flopped" as one problem is what keeps people stuck. If your reach specifically has fallen off a cliff, our post on why Instagram Reels stop getting views covers the seven causes worth ruling out first.
It also helps to know what "good" looks like at the top rather than the middle. In the Reels study, the top 10% of posts averaged 30.0% engagement per view against 4.1% for the mid-pack, and held a 49.2% watch ratio against 30.2%. The gap between average and excellent is large, which is encouraging: it means the ceiling is high, and small structural fixes have real room to move you.
The Short Version
A flop has a cause, and the cause is usually findable. Your native dashboard won't find it for you, because it was never built to. It shows you the score, not the game.
Three things to take away. First, read the shape of the retention curve before you touch anything, because the shape names the problem. Second, compare against your own baseline, not against benchmarks from accounts nothing like yours. Third, change one variable at a time, or you're guessing with extra steps.
You don't need to keep posting into the dark. Start your $1 trial and get 30 days of full analysis on your own account, including the flops you've been trying not to think about. Thirty days is enough to find at least one pattern you didn't know was there.
Frequently Asked Questions
Can AI really tell me why my video flopped?
It can tell you which measurable element most likely caused the drop-off, like a weak first three seconds or a mid-video pacing break. It reads your video's content and matches it against your own performance history. It can't tell you whether the underlying idea was interesting, which is still a judgment call you have to make.
How many videos do I need before an analyzer is useful?
Roughly thirty to fifty posts on the account you're analyzing. Below that there isn't enough history to separate a real pattern from random variation. Tools will still produce output with less, but you should treat early conclusions as loose hints rather than findings.
Is a low completion rate always a hook problem?
No, and this is the most common misdiagnosis. A cliff in the first three seconds is a hook problem. A steady decline across the whole video is usually pacing, and a sharp mid-video drop points to one specific moment. Fixing the hook on a pacing problem just makes a short video that still loses people.
Do these tools work the same on TikTok, Instagram and YouTube?
The content analysis is similar, but the performance signals differ by platform. TikTok weights watch time and completion most heavily, according to Hootsuite's ranking-signal breakdown, while YouTube surfaces its own viewed vs. swiped away figure for Shorts. A cross-platform tool should read each one on its own terms rather than averaging them.
Should I analyze my best videos too, or just the flops?
Both, and ideally in the same session. Flops tell you what to stop doing. Winners tell you what to repeat, which is the harder and more valuable half. Most creators can name their worst habits and have no idea what their actual strengths are.
Frequently asked questions
Can AI really tell me why my video flopped?
It can tell you which measurable element most likely caused the drop-off, like a weak first three seconds or a mid-video pacing break. It reads your video's content and matches it against your own performance history. It can't tell you whether the underlying idea was interesting, which is still a judgment call you have to make.
How many videos do I need before an analyzer is useful?
Roughly thirty to fifty posts on the account you're analyzing. Below that there isn't enough history to separate a real pattern from random variation. Tools will still produce output with less, but you should treat early conclusions as loose hints rather than findings.
Is a low completion rate always a hook problem?
No, and this is the most common misdiagnosis. A cliff in the first three seconds is a hook problem. A steady decline across the whole video is usually pacing, and a sharp mid-video drop points to one specific moment. Fixing the hook on a pacing problem just makes a short video that still loses people.
Do these tools work the same on TikTok, Instagram and YouTube?
The content analysis is similar, but the performance signals differ by platform. TikTok weights watch time and completion most heavily, while YouTube surfaces its own viewed vs. swiped away figure for Shorts. A cross-platform tool should read each one on its own terms rather than averaging them.
Should I analyze my best videos too, or just the flops?
Both, and ideally in the same session. Flops tell you what to stop doing. Winners tell you what to repeat, which is the harder and more valuable half. Most creators can name their worst habits and have no idea what their actual strengths are.