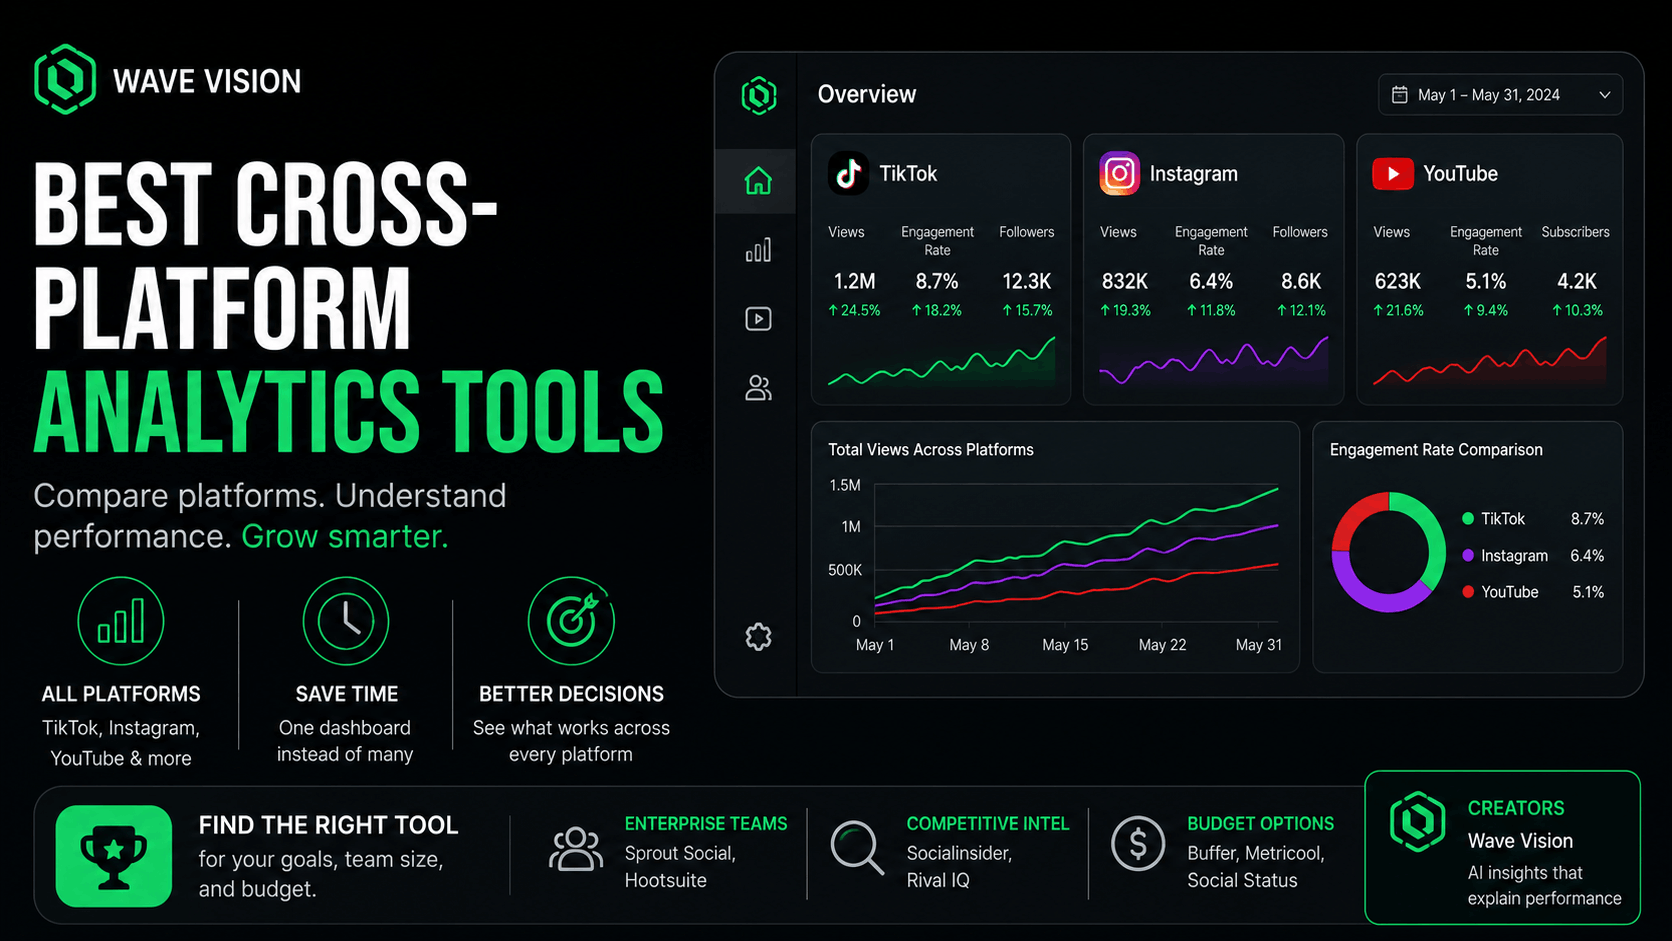
TL;DR: The best cross-platform social media analytics tools pull TikTok, Instagram, YouTube, and other platforms into one dashboard so you're not comparing numbers by hand. Enterprise tools like Sprout Social and Hootsuite serve teams managing many brands, competitive tools like Socialinsider and Rival IQ focus on benchmarking, and creator-first tools like Wave Vision focus on content-level feedback. This post breaks down what "cross-platform" actually means, the metric mismatches that trip people up, and which tool fits which use case.
What Makes Analytics "Cross-Platform"
Cross-platform social media analytics means pulling performance data from multiple networks, TikTok, Instagram, YouTube, and others, into a single view instead of checking each platform's native dashboard separately. It sounds simple, but the value isn't just convenience. It's the ability to ask bigger questions than any single platform's analytics can answer, like which platform actually drives the most brand deal interest, not just which one has the most followers.
Native analytics tools like Instagram Insights or TikTok Studio are genuinely good at what they do, but they only show you your own account on their own platform. A cross-platform tool adds the comparison layer on top, which is where patterns that single-platform reporting hides start to show up.
The Hidden Problem: Platforms Don't Define Metrics the Same Way
Here's the part that trips up a lot of people once they start comparing platforms side by side: the same metric name can mean something completely different depending on where you're measuring it. Instagram typically calculates engagement rate using followers or reach, while TikTok commonly calculates it using views. Two posts with an identical engagement rate on paper can represent very different levels of actual audience response.
This matters more than it sounds like it should. If you're comparing your TikTok and Instagram performance using each platform's own definition of engagement rate, you're not actually comparing apples to apples, you're comparing two different formulas that happen to share a name. A cross-platform tool worth using should normalize these definitions, or at minimum be transparent about how it's calculating each number, so your comparisons actually mean something.
The same issue shows up with views, impressions, watch time, and reach. Every platform has its own logic for what counts and what doesn't, which is exactly why manually copying numbers between native dashboards, even into a spreadsheet, can quietly produce a distorted picture of which platform is actually performing best.
Best Cross-Platform Analytics Tools by Use Case
The right cross-platform tool depends heavily on who's using it, since "cross-platform analytics" covers everything from enterprise brand monitoring to a solo creator checking their last five posts.
For enterprise teams and agencies: Sprout Social and Hootsuite dominate this tier. Sprout Social runs $249 to $499 a month per user and focuses on cross-team collaboration, stakeholder-ready reports, and deep integrations. Hootsuite starts around $99 a month per user and leans into social listening at scale, pulling from over 150 million sources on its top tier. Both are built for teams managing multiple brands or client accounts, not a single creator's own performance.
For competitive benchmarking: Socialinsider and Rival IQ specialize in comparing your performance directly against named competitors, not just industry averages. Socialinsider's Query Builder lets you track specific campaigns or hashtags across channels, while Rival IQ offers free head-to-head competitor reports as an entry point before its paid tiers.
For budget-conscious small teams: Buffer and Metricool cover the basics at a fraction of enterprise pricing. Buffer's paid plans start around $6 a month per channel and support a wide range of platforms, though cross-platform aggregation and historical data are limited on lower tiers. Metricool's free plan includes about three months of historical data, which is more generous than most native tools offer on their own.
For individual creators: This is where most of the tools above start to feel like the wrong shape for the job. Sprout and Hootsuite are priced and built for teams, and even the budget options like Buffer are scheduling-first with analytics as a secondary feature. Wave Vision is built specifically for this use case: connecting TikTok, Instagram, and YouTube for a single creator, then layering AI Video Analysis on top so you're seeing not just that a video underperformed, but why. We cover exactly how that feedback works in our post on hook analysis tools for short-form video.
What to Look for in a Cross-Platform Analytics Tool
Not every tool that claims cross-platform support actually solves the problem you're hiring it to solve. A few things separate a genuinely useful cross-platform tool from one that just adds another dashboard to check.
It should support the specific platforms you actually post to, which sounds obvious but trips people up constantly, since some tools have strong Instagram support and weak TikTok coverage, or vice versa. It should show metrics side by side rather than in separate tabs you have to click between. It should be transparent about how it calculates cross-platform metrics like engagement rate, given the definition mismatch covered above. And for anyone managing more than one or two accounts, it needs a real answer for tracking multiple accounts without losing hours to app-switching every week.
The tools that fail this test usually look impressive in a demo but leave you doing the same manual comparison work you were trying to avoid, just inside a nicer-looking interface.
Where Wave Vision Fits
Most of the tools covered so far were built first for teams and later adapted for individual creators, or built as a scheduler with analytics bolted on. Wave Vision was built the other way around: for a single creator managing their own TikTok, Instagram, and YouTube accounts who wants performance data and content-level feedback in the same place.
That distinction shows up most clearly in what happens after you connect your accounts. Instead of just a side-by-side view of engagement rate and follower growth, Vision analyzes individual videos and identifies what's actually driving performance, whether that's hook strength, pacing, or a mismatch between your opening promise and the rest of the video. If you're trying to translate that into pitch-ready proof for brand deals, our guide to analytics for UGC creators covers which specific metrics matter for that conversation, and our post on measuring social media ROI as a creator covers how to turn that data into an honest picture of whether your content time is actually paying off.
How to Evaluate a Tool Before Committing
Before picking a cross-platform tool, run it against your actual accounts rather than trusting a features page. Connect your real TikTok, Instagram, or YouTube account during a trial period and check whether the numbers it shows match what you already see in each platform's native dashboard, since discrepancies of 5 to 10% between third-party tools and native analytics are common due to API sampling.
Check how far back its historical data goes and whether that matches how you actually plan to use it, since a tool capped at 90 days won't help you spot a seasonal pattern from six months ago. And weigh the price against what you're actually managing: an enterprise tool priced for a ten-person team is the wrong fit for a solo creator, in the same way a scheduling-first budget tool is the wrong fit for someone who needs content-level video feedback, not just a bigger dashboard.
Conclusion
"Cross-platform" covers a wide range of tools built for very different jobs, from enterprise brand monitoring to a solo creator trying to figure out why one video outperformed another. The right pick depends less on which tool has the longest features list and more on matching the tool to the actual size and shape of what you're managing.
If you're a creator looking for TikTok, Instagram, and YouTube performance side by side, with AI feedback on what's actually driving results, start your $1 trial with Wave Vision and compare it against your current setup.
Frequently Asked Questions
**What is cross-platform social media analytics?**Cross-platform social media analytics means pulling performance data from multiple social networks into one dashboard, rather than checking each platform's native analytics separately. It allows comparisons across platforms that single-platform reporting can't show.
**Why do the same metrics look different across platforms?**Platforms often calculate the same-named metric differently. For example, Instagram typically calculates engagement rate based on followers or reach, while TikTok commonly calculates it based on views, which means identical-looking numbers can represent very different levels of actual engagement.
**What's the best cross-platform analytics tool for a solo creator?**Solo creators are generally better served by creator-first tools like Wave Vision rather than enterprise platforms like Sprout Social or Hootsuite, which are priced and built for teams managing multiple brands or client accounts.
**Are enterprise cross-platform analytics tools worth it for small accounts?**Usually not. Enterprise tools like Sprout Social ($249 to $499 a month) and Hootsuite (starting around $99 a month per user) include team collaboration and competitive intelligence features that most solo creators and small accounts don't need or use.
**How accurate is third-party cross-platform analytics compared to native tools?**Third-party tools pull data through platform APIs, which can introduce delays and minor discrepancies, sometimes 5 to 10% difference from native analytics due to sampling methods. It's worth spot-checking a new tool's numbers against native analytics during a trial period.
Frequently asked questions
What is cross-platform social media analytics?
Cross-platform social media analytics means pulling performance data from multiple social networks into one dashboard, rather than checking each platform's native analytics separately. It allows comparisons across platforms that single-platform reporting can't show.
Why do the same metrics look different across platforms?
Platforms often calculate the same-named metric differently. For example, Instagram typically calculates engagement rate based on followers or reach, while TikTok commonly calculates it based on views, which means identical-looking numbers can represent very different levels of actual engagement.
What's the best cross-platform analytics tool for a solo creator?
Solo creators are generally better served by creator-first tools like Wave Vision rather than enterprise platforms like Sprout Social or Hootsuite, which are priced and built for teams managing multiple brands or client accounts.
Are enterprise cross-platform analytics tools worth it for small accounts?
Usually not. Enterprise tools like Sprout Social ($249 to $499 a month) and Hootsuite (starting around $99 a month per user) include team collaboration and competitive intelligence features that most solo creators and small accounts don't need or use.
How accurate is third-party cross-platform analytics compared to native tools?
Third-party tools pull data through platform APIs, which can introduce delays and minor discrepancies, sometimes 5 to 10% difference from native analytics due to sampling methods. It's worth spot-checking a new tool's numbers against native analytics during a trial period.