TL;DR: Analytics for UGC creators means tracking a different set of numbers than a traditional influencer would. Brands hiring UGC creators care less about follower count and more about engagement rate, retention, hook strength, and proof that your content actually performs. This post breaks down which metrics matter most, how to read them by platform, and how to turn your analytics into a portfolio that lands paid deals instead of gifted products.
Why UGC Creators Need Different Analytics Than Influencers
UGC creators get hired for a different reason than influencers, and that changes which numbers matter. Influencers get paid to post to their own audience, so reach and follower count carry real weight. UGC creators are hired to produce content a brand owns and reuses across ads, product pages, and their own channels, whether or not the creator ever posts it publicly.
That distinction means a brand evaluating a UGC creator isn't asking "how many people follow you." They're asking "can this person make content that performs when we put it in front of an audience we're paying to reach." Follower count barely factors in. What matters instead is whether your content holds attention, whether it looks native rather than like an ad, and whether you understand why a piece of content worked.
This is also why so many successful UGC creators have modest followings. If you're building your own audience alongside UGC work, our post on what a good engagement rate looks like on TikTok in 2026 breaks down the benchmarks that matter more than raw follower counts, and the same logic carries directly into UGC pitching.
The Metrics That Actually Matter for UGC Creators
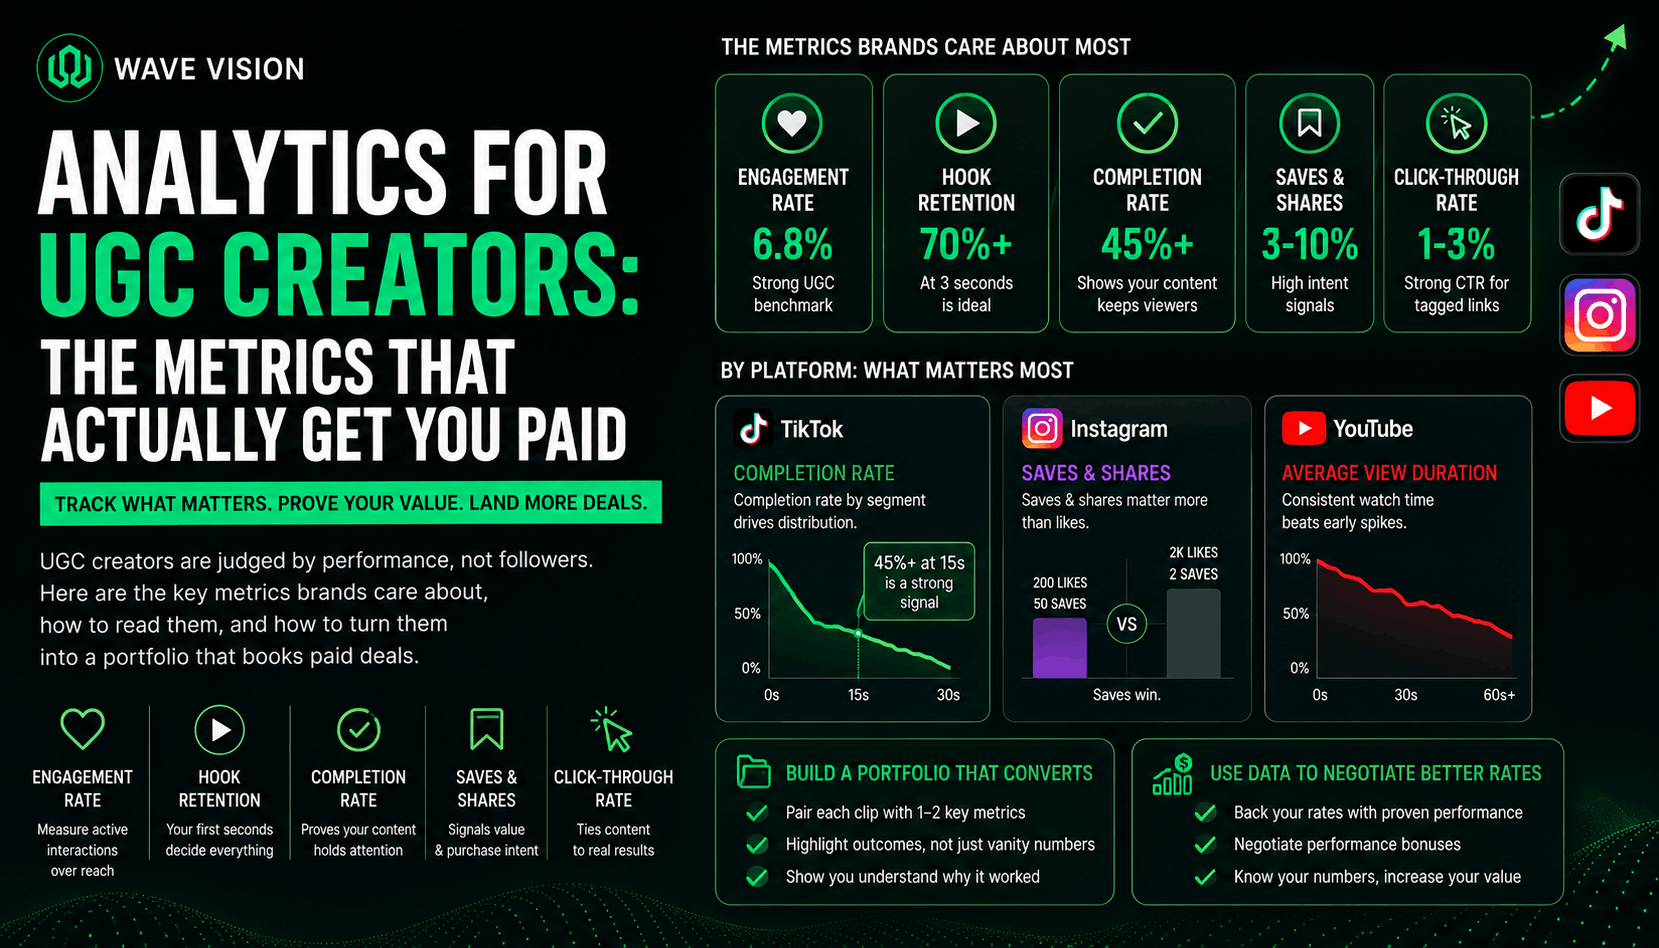
Five metrics do most of the work when it comes to proving your value as a UGC creator: engagement rate, hook retention, completion rate, saves and shares, and click-through rate on any tagged links.
Engagement rate shows how actively people interact with your content relative to its reach, and it's a stronger signal of audience trust than raw view count. Hook retention shows whether your opening seconds hold attention, which predicts distribution on nearly every platform. Completion rate shows whether the whole piece delivers, not just the first few seconds. Saves and shares matter because they signal content someone found valuable enough to revisit or pass along, which is exactly the kind of behavior a brand wants their paid content to trigger. And click-through rate matters directly if a brand deal involves a tagged link or discount code, since it ties your content straight to a business outcome.
None of these require a massive following to prove. A creator with 8,000 followers and a 45% completion rate on their product demos is a stronger UGC hire than a creator with 80,000 followers and a 12% completion rate, because the first creator's content is more likely to hold attention when a brand puts money behind it.
Platform-by-Platform: What Each App Rewards
Analytics for UGC creators isn't one-size-fits-all. Each platform weighs a different signal most heavily, and knowing which one matters where changes how you should edit and pitch.
TikTok rewards video completion rate above almost everything else, and specifically completion rate by segment, meaning how many viewers are still watching at the 15-second mark of a 30-second video, not just whether they finished. A TikTok completion rate of 45% or higher at the halfway point is generally considered a strong signal that a piece of content is worth amplifying with paid spend.
Instagram leans more heavily on saves and shares than likes. A post with 200 likes and 50 saves often carries more algorithmic and business value than a post with 2,000 likes and almost no saves, because saves indicate someone wants to come back to the content, which is a much stronger purchase-intent signal for a brand. We covered how this plays into growth more broadly in our breakdown of the best Instagram analytics tools for creators.
YouTube, including Shorts, weighs average view duration heavily, and unlike TikTok's steep early drop-off curve, YouTube's decay pattern rewards content that holds attention steadily across the whole runtime, which matters if you're producing longer-form UGC like tutorials or reviews.
How to Turn Your Analytics Into a Portfolio That Gets You Booked
Numbers alone don't close deals. Brands scan a UGC portfolio in under 30 seconds, so your analytics need to sit directly next to the content they're describing, not buried in a separate spreadsheet.
The strongest format pairs each clip with one or two hard numbers: "18K views, 6.8% engagement rate" next to a testimonial video, or "42% completion rate" next to a product demo. This does more than prove reach, it proves you understand why the content worked, which is exactly the judgment brands are paying for when they hire a UGC creator over generating content in-house.
If you've worked with brands before, lead with outcome-based proof rather than vanity numbers. "My content for [brand] drove a measurable lift in product page conversion" carries more weight in a pitch than a follower count ever will, because it ties your work directly to a result the next brand cares about.
Using Analytics to Negotiate Better Rates
Analytics aren't just for landing the deal, they're your best leverage once you're negotiating rate. A documented track record lets you anchor pricing to past performance instead of defaulting to whatever a brand offers first.
This is also where performance-based pricing comes in. Some brands will offer a base rate plus a bonus tied to a specific metric, like an extra payment if your content clears a click-through rate threshold once it's running as an ad. Knowing your own average completion rate and engagement rate before that conversation starts means you can negotiate from data instead of guessing what you're worth.
It also protects you from underpricing. A creator who can point to a consistent 40%+ completion rate across their last ten videos has a much stronger case for a premium rate than a creator who can only point to follower count, since completion rate is closer to what actually predicts ad performance for the brand.
How Wave Vision Fits Into a UGC Creator's Analytics Workflow
Most UGC creators are producing content across TikTok, Instagram, and sometimes YouTube at the same time, which means the metrics that matter are scattered across three separate native dashboards. Wave Vision pulls engagement rate, completion rate, and account performance from all three into one view, so you're not screenshotting three apps every time a brand asks for proof.
The AI Video Analysis feature goes a step further by scoring individual videos and explaining what's actually driving performance, whether that's a strong hook, a pacing issue, or a mismatch between the opening promise and the payoff. We broke down exactly how hook strength affects retention in our post on hook analysis tools for short-form video, which is often the fastest lever for a UGC creator trying to raise completion rate before their next round of brand pitches.
If you're already managing multiple accounts for different niches or clients, our guide to tracking multiple social accounts in one dashboard walks through how to set that up without losing hours to app-switching every week.
Common Analytics Mistakes UGC Creators Make
A few patterns show up again and again among UGC creators who struggle to convert pitches into paid deals, and most of them come down to tracking the wrong numbers or not tracking at all.
The first is leading with follower count in a pitch. It's the metric brands care about least for UGC specifically, and leading with it signals you don't understand the difference between UGC and influencer work.
The second is not updating your portfolio metrics regularly. A portfolio showing six-month-old numbers reads as inactive, even if you've posted consistently since. Refresh your best-performing clips and their stats at least monthly.
The third is tracking vanity metrics instead of predictive ones. Total views feels good to report, but a brand cares more about completion rate and engagement rate, since those numbers predict how your content will perform once real ad spend is behind it.
Conclusion
Analytics for UGC creators isn't about chasing the biggest numbers, it's about tracking the handful of metrics that actually predict whether your content will perform once a brand puts money behind it. Engagement rate, hook retention, completion rate, and saves matter more than follower count, and pairing that data with your portfolio is what turns a cold pitch into a paid deal.
If you want to see your engagement rate, completion rate, and hook performance across TikTok, Instagram, and YouTube in one place, start your $1 trial with Wave Vision and run your last five posts through AI Video Analysis before your next brand pitch.
Frequently Asked Questions
**What analytics do brands look for in a UGC creator?**Brands evaluating UGC creators care most about engagement rate, completion rate, hook retention, and saves or shares, rather than follower count. These metrics predict how well a piece of content will perform once a brand puts paid distribution behind it.
**Do UGC creators need a large following to get hired?**No. UGC creators are hired to produce content a brand owns and reuses, not to post to their own audience, so a smaller creator with strong engagement and completion rates is often a stronger hire than a larger account with weak retention.
**What's the difference between UGC creator analytics and influencer analytics?**Influencer analytics focus on reach and follower growth, since influencers are paid to distribute content to their own audience. UGC creator analytics focus on content performance signals like completion rate and hook retention, since UGC creators are paid for the content itself, not the distribution.
**How often should I update my UGC portfolio analytics?**Update your portfolio's performance numbers at least monthly. A portfolio showing outdated metrics can read as inactive to a brand, even if you're posting consistently, and current numbers strengthen your pitch.
**Can analytics help me negotiate a higher UGC rate?**Yes. A documented track record of engagement rate and completion rate gives you leverage to anchor pricing to past performance instead of accepting a brand's first offer, and it supports performance-based bonus structures tied to specific metrics.
Frequently asked questions
What analytics do brands look for in a UGC creator?
Brands evaluating UGC creators care most about engagement rate, completion rate, hook retention, and saves or shares, rather than follower count. These metrics predict how well a piece of content will perform once a brand puts paid distribution behind it.
Do UGC creators need a large following to get hired?
No. UGC creators are hired to produce content a brand owns and reuses, not to post to their own audience, so a smaller creator with strong engagement and completion rates is often a stronger hire than a larger account with weak retention.
What's the difference between UGC creator analytics and influencer analytics?
Influencer analytics focus on reach and follower growth, since influencers are paid to distribute content to their own audience. UGC creator analytics focus on content performance signals like completion rate and hook retention, since UGC creators are paid for the content itself, not the distribution.
How often should I update my UGC portfolio analytics?
Update your portfolio's performance numbers at least monthly. A portfolio showing outdated metrics can read as inactive to a brand, even if you're posting consistently, and current numbers strengthen your pitch.
Can analytics help me negotiate a higher UGC rate?
Yes. A documented track record of engagement rate and completion rate gives you leverage to anchor pricing to past performance instead of accepting a brand's first offer, and it supports performance-based bonus structures tied to specific metrics.